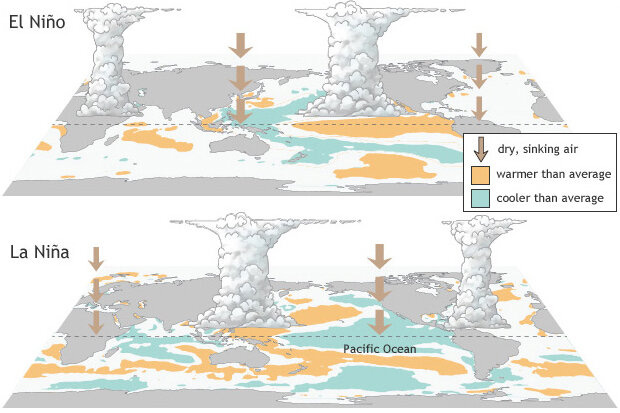
Rare is the weather report these days that doesn’t mention El Niño, the climatological phenomenon that is often to blame for excessive rains or snowfall, depending on the season. American meteorologists and science writers find themselves explaining more and more often how this large-scale, multi-continental pattern affects local weather in Pacific coast states and beyond. Even though I live on the East Coast, my local news station published an article last month explaining the record-high ocean and air temperatures (and therefore our warmer-than-average spring) were caused in large part by the El Niño Southern Oscillation (ENSO). ENSO’s El Niño phase, which brings warm & wet conditions to the Americas and cool & dry conditions to Australia and Oceania, is balanced by the La Niña phase, which brings cool, dry air to the Americas and leads to stronger typhoons and cyclones in the western Pacific.
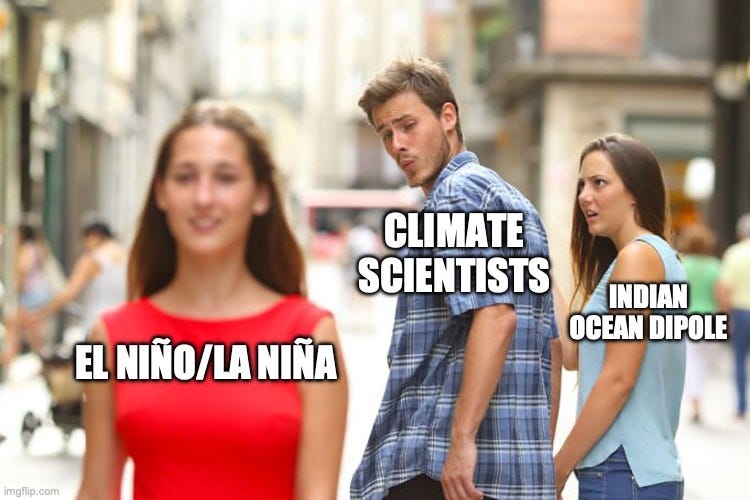
ENSO is a widely-studied, popularly recognizable phenomenon. This is partly because the ‘science’ itself is pretty straightforward: warmer ocean temperatures in the eastern Pacific leads to more water evaporating and thus more precipitation falling in the Americas. But what if I told you there’s a climate pattern so similar to ENSO it’s sometimes referred to as the “Indian Niño?” The Indian Ocean Dipole describes the naturally-oscillating sea surface temperatures (SSTs) in the Indian Ocean, which affects monsoons, wildfires, and droughts in across three continents. It has been well-established for decades, yet it is less studied and therefore less talked about than El Niño. As I’ve mentioned before in this series, the ocean is like a giant tub that’s slowly heating up and affecting Earth’s climate. This week, we’ll look at both the Indian Ocean Dipole (IOD) and ENSO to examine how science informs (or tries to inform) media coverage of climate change.
First of all, how do ENSO and the IOD affect each other?
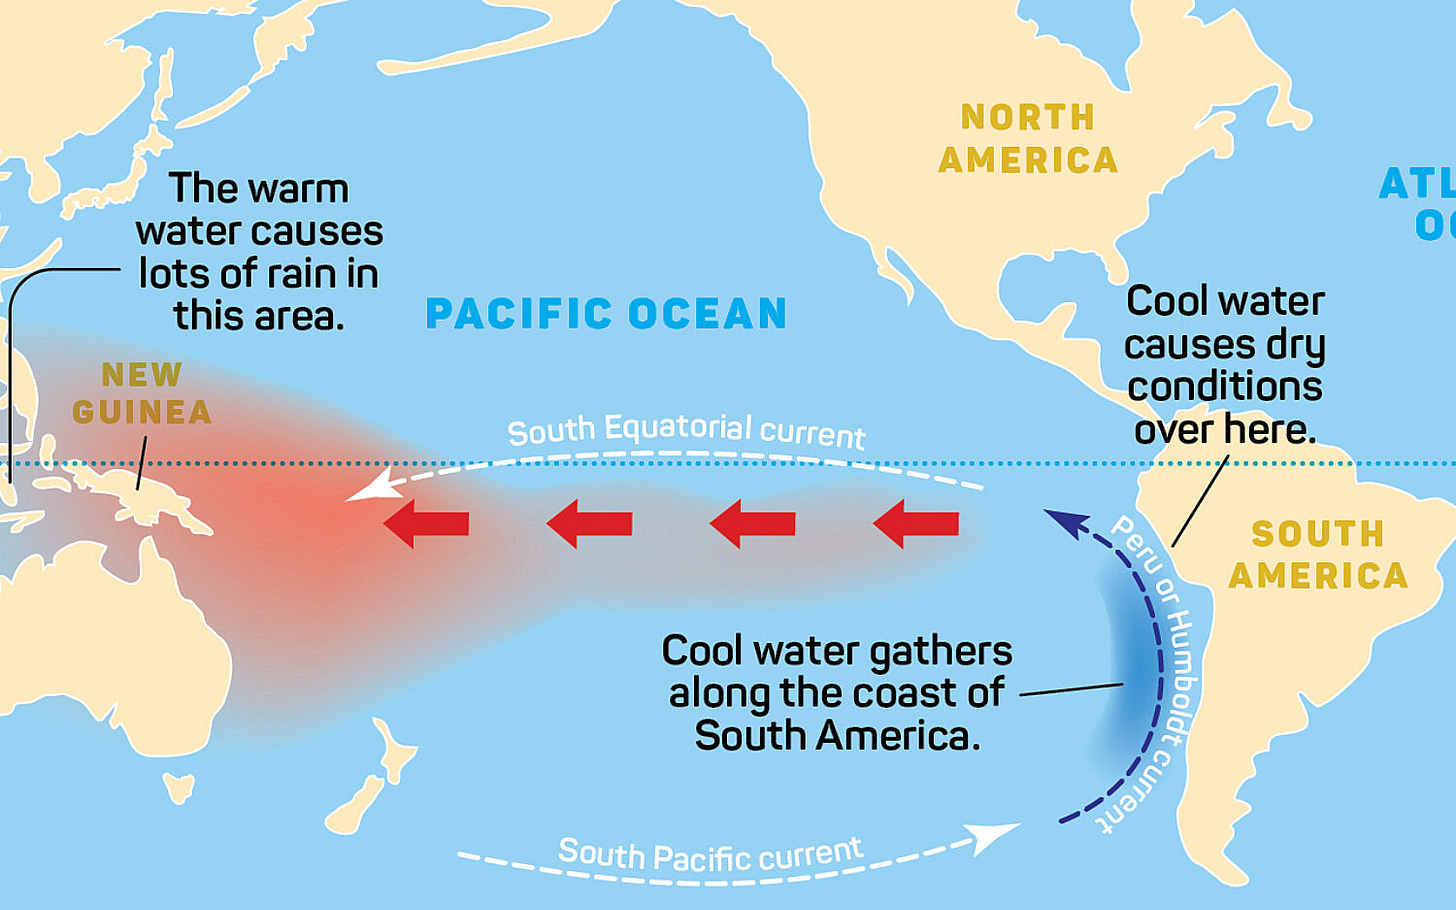
El Niño was first observed by 17th-century Peruvian fishermen, who noticed changes in their fishing yield around Christmastime each year. The dense, nutrient-rich water from Antarctica rises up the water column once it reaches the western coast of South America because winds have displaced the surface water westward. This natural cycle forms one side of the South Pacific gyre. As you can see from the graphic below, the Peru/Humboldt current brings water northwards from the South Pole. The water then moves westward across the equator, gaining heat from the sun and causing surface waters to evaporate. The rest of this now-warm water then flows gently down Australia’s east coast and finds its way back into the Southern Ocean and Antarctica.

The exact location of this evaporation shifts every so often due to slight changes in Earth’s rotation, which varies the amount of heat coming from the sun (these are called orbital forcings). Scientists have spent decades trying to determine how various orbital forcings have created ENSO and continue to influence its timing and placement. Basically, the line of latitude where the sun’s rays hit the earth dictates the strength of the equatorial winds: stronger winds blow the center of evaporation into the western Pacific, causing an ENSO-negative phase or a La Niña. During this event, South American coastal upwelling is intensified; the extra cold water coming to the surface makes conditions in the Americas cooler and drier than normal and those in the western Pacific much rainier and hotter. When equatorial winds are weaker, the center of evaporation shifts towards the eastern Pacific, causing an ENSO-positive phase aka El Niño, which is characterized by higher-than-normal SSTs in the eastern Pacific and reduced rainfall in Australia & Asia. The pressure differential caused by these SSTs can sometimes be so strong that winds start blowing backwards along the equator!

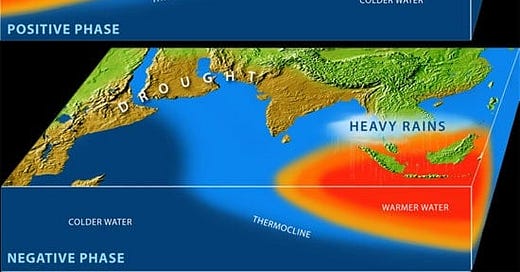
The Indian Ocean Dipole (IOD) functions exactly like ENSO in that it also oscillates between positive and negative phases, bringing heat and moisture to Eastern Africa or western Australia in turn. When the IOD is positive, like it has been this spring, SSTs off the African and Indian coast increase, leading to more evaporation, stronger storms, and wetter monsoons. This often results in deadly flooding and mudslides: last month, NBC News reported that 175+ people had been killed in and around Nairobi as a result of persistent heavy rains (thanks IOD).
Although the periodicity of IOD is shorter than ENSO (six months instead of twelve), a quick look at graphics from NASA’s Jet Propulsion Laboratory show striking overlaps:

Nearly all of the El Niños (represented by the color red in Figure 1) occur when the Indian Niño is in a strong positive phase (Figure 2 red) or in an average-neutral phase (when the index is within 0.5 of the x axis). As one would expect, La Niña conditions appear when the IOD is also in its cooler, negative phase. Australia’s Bureau of Meteorology observes that concurrent positive ENSO and IOD “reinforce [the phases’] dry effects” in the eastern Pacific. A group of researchers concurred with this assessment after studying the effect global climate patterns had on Australia’s devastating 2020 bushfire season. It’s as if Oceania is a magnet, attracting warmth and moisture from the Pacific and Indian Oceans simultaneously; like all magnets, its poles flip every so often, sending those high SSTs to opposing ends of its reach.
While ENSO and the IOD could ‘cancel’ each other out in theory, research has shows that this rarely happens in practice, at least in the past 30 years. ENSO and IOD work in tandem, feeding off of each other’s strengths and diminishing any weaknesses. Furthermore, recent studies have shown a “positive skewness” of both the IOD and ENSO wherein the oscillations have stronger positive phases and weaker negative ones. This would increase the periodicity of both oscillations, which would prolong the drought in Australia and lead to more rainfall for longer periods of time over East Africa and the Americas.
Why don’t I know more about the IOD?
While ENSO conditions have been monitored for decades, scientists have only begun measuring the IOD in the past 25 years, not because it was recently invented by the Climate Gods but because it was thought to be part of ENSO until scientists began studying its effects on the ocean. A paper by Kim et.al. published just two months ago discusses how ENSO only has “a remote influence” on future IOD variability, which is mainly exerted through “wind stress variability” (aka ENSO may influence the atmospheric part of IOD). Yet this effect diminishes in the presence of higher-than-average Indian Ocean SSTs — as Kim et. al. put it, the IOD’s strength is “tightly correlated to the mean state of the tropical Indian Ocean.” Furthermore, a 2021 analysis of the Indian Ocean found that changes in the temperature and salinity of the water column can happen independently of ENSO conditions, and Indian Ocean SSTs can be so warm that they actually cause an El Niño event!

As you can see from the graphic above, there are weather and climate monitoring stations all across the Southern Hemisphere, able to track changes in precipitation, SST, and sea surface height in not one but two oceans. Despite this presumable wealth of data, the IOD remains understudied. The two most popular scientific journals, Nature and Science, have a striking lack of scholarship: in the past twelve months, 333 papers published in Nature mention El Niño/ENSO compared to 114 that discuss the IOD. And while Science only has 34 papers published so far this year about ENSO, the total IOD research papers number only at eight…! After realizing these results are limited to English-language articles, I conducted a quick search on Google Scholar and found depressingly similar results: there are 3,550 articles published in 2024 that mention ENSO, which is double the amount of those about the Indian Ocean Dipole (only 1,790). This disparity makes little sense, and unless oceanography is tainted by a Western-centric outlook, it can only be explained by noting that in some circles the IOD’s very existence as an independent climate phenomenon is contested. Yet this should make it more discussed, not less…!
Less 'media circus’, more ‘media freak show’
Earth is currently experiencing both a positive IOD and a positive ENSO, setting up potential extreme drought-like conditions in Oceania and Southeast Asia and record-setting storm seasons in African and the Americas. So why aren’t there more stories about the IOD? While the Indian Niño receives less attention within the scientific community, it still has a presence within the discourse, which can hardly be said about its media coverage. For example, the most recent New York Times article about devastating floods in Kenya mentions the IOD as an afterthought: “United Nations experts have attributed the heavier-than-usual rains to a combination of two natural climate cycles: El Niño, which increases the likelihood of wet conditions in certain parts of the world, and a similar pattern called the Indian Ocean Dipole.” Even the links in this quote illustrate the differences in coverage: “El Niño” directs readers to a 2023 NYT article explaining in-depth the origins of the phenomenon whereas “the Indian Ocean Dipole” sends readers to the very page on NOAA’s website that is the first result in a simple Google search! Oh, and the ratio of ENSO to IOD articles in the New York Times? 1,879 to 4.
Whenever the IOD is mentioned, journalists tend to play up the mystery. In June 2020, there was BBC article on the plausibility of British weather being influenced by climate phenomena in remote places of the world. In it, the journalist wonders “What’s influencing the Indian dipole? Or is it completely natural?” and proceeds to quote a scientist who answers “We’re not sure yet.” Admittedly lots more research has been conducted on the IOD since the article was published, but I was surprised by the author’s lack of curiosity about the phenomenon.
This disparity of coverage is not limited to the Western world: the Indian Ocean Dipole receives minimal coverage even by the media in areas where its impacts are immediately noticeable. As discussed above, the IOD affects the climate and weather of large swaths of the African continent as well as the Indian subcontinent. Yet The Times of India and Africa News Agency, the most widely-read papers in each of their respective areas, disproportionately cover ENSO. While ANA’s website did not offer a sum total of articles fetched for my “El Niño” search, it politely informed me in French that “Indian Ocean Dipole” yielded no results (to see all the evidentiary screenshots, click here). And for every 1 article on the IOD published by the Times of India, there were 8 about El Niño!
Now, you may think it unfair of me to continually attack mainstream organizations’ coverage of ocean and climate science. While they have the budget to hire highly intelligent writers, not every journalist covering the climate beat has a science background, let alone a marine science one. But even three of the most popular climate and environmental science websites — Grist, Mongabay, and Inside Climate News — have a shocking lack of information on the IOD. The screenshots speak for themselves:


Conclusion
A book of research published by the American Geophysical Union in 2020 explained how extreme positive ENSOs (aka El Niños) will increase in frequency as our planet warms. The location of each El Niño and La Niña will also shift further eastward and westward, respectively, intensifying rainfall on one side of the Pacific and drought on the other. But all hope is not lost: a growing body of scientific studies demonstrate how a gradual decrease in atmospheric CO2 also decreases the potential for extreme weather events. The IOD’s future is a bit harder to predict, but only because there are fewer conclusive studies about its dynamic. According to Climate.gov, extreme positive IOD events will occur almost three times as often in the 21st century relative to the 20th century. While most climate models disagree about the degree IOD will change in the coming decades, a group of scientists explained in this 2020 news article that the dipole will become increasingly polarized. According to their models, they found “a statistically significant decrease of 16% for moderate event variability and a 22% increase for strong events,” changes that they assert will happen independently from ENSO.
So, instead of thinking about climate phenomena as independent operators in each area of the world, scientists and journalists should instead aim to explain climate change with a truly global outlook — after all, just because a climatological phenomenon isn’t happening directly on your land doesn’t mean you are not affected by it. In the orchestra that is our climate, ENSO is the first violinist, the visible face and presumed leader of the ensemble. They’re the player closest to the audience and the one most people observe when they want to analyze what’s going on in the rest of the orchestra. Casual concertgoers will notice how, before the show begins, all musicians appear to tune their instruments in accord with the violin. Yet the instrument actually in charge of setting the tune is the oboist: her instrument’s pitch is reliably steady. The oboe’s influence is not diminished just because she’s harder for audience members to spot — indeed, the more we pay attention to her sound, the louder she becomes.
Sources not linked above:
Kim, SK., Park, HJ., An, SI. et al. Decreased Indian Ocean Dipole variability under prolonged greenhouse warming. Nat Commun 15, 2811 (2024). https://doi.org/10.1038/s41467-024-47276-7 Web.
Timmermann, A., S. J. Lorenz, S-I. An, A. Clement, and S-P. Xie. "The Effect of Orbital Forcing on the Mean Climate and Variability of the Tropical Pacific." Journal of Climate 20.16 (2007): 4147-4159. https://doi.org/10.1175/JCLI4240.1 Web.
Australia's Bureau of Meteorology | USA Climate.gov ENSO predictions | USA Climate.gov IOD | NOAA | Carbon Brief scientists' guest article


Wow! Thanks for the much needed schooling in ENSO and IOD. I think you should pitch some stories to those outlets about all this, and I have a contact at University of Arizona that I can share. Ocean science is climate science!